Article • 1 min read
Tip of the week: Including 0 values in Insights reports
Von Sarah Hagberg
Zuletzt aktualisiert: October 27, 2015
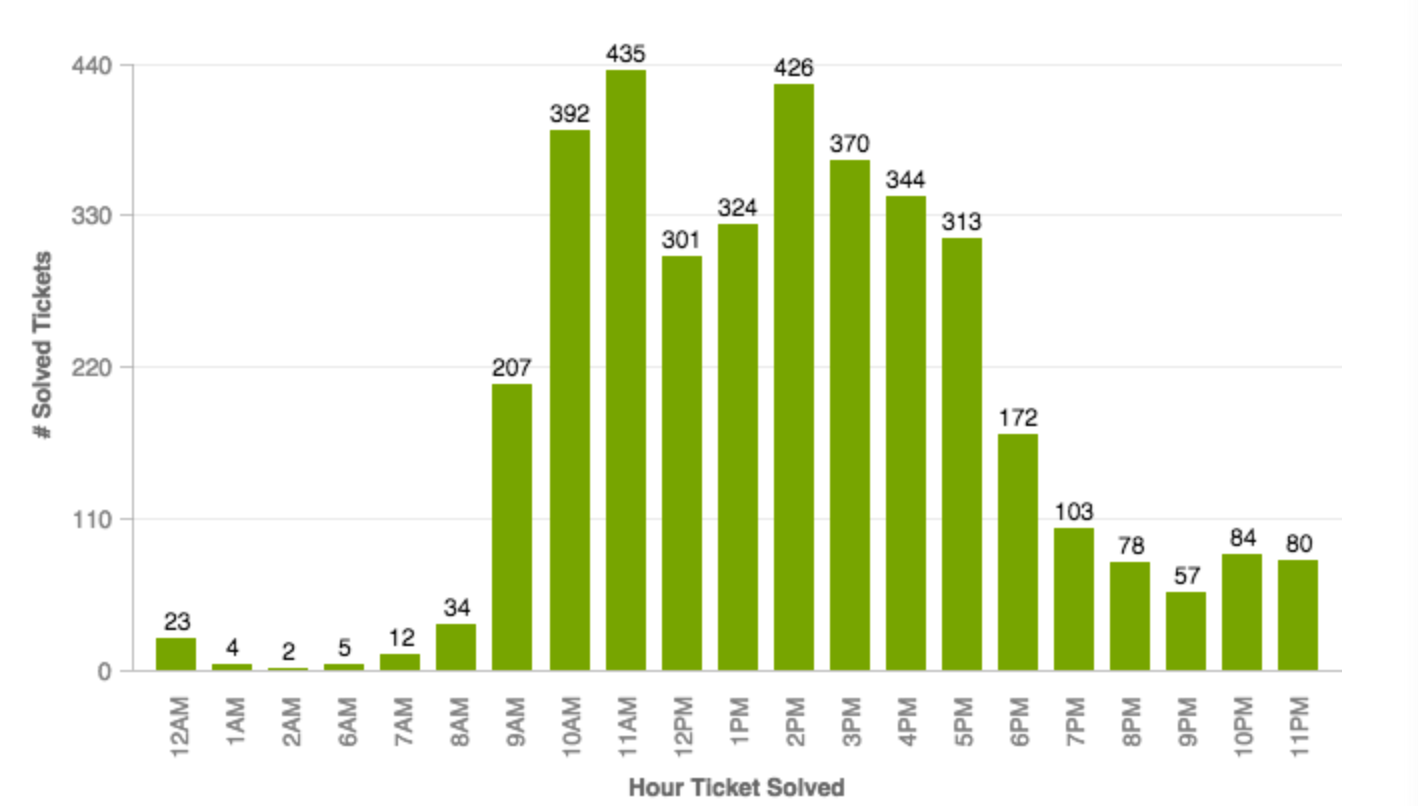
Do you have reports where the X-Axis value disappears if it is a 0 value?
For example, in this bar graph the hours 3 a.m., 4 a.m., and 5 a.m. have disappeared because no tickets were solved in those hours.

This tip of the week covers how to include 0 values in Insights reports. Note: This metric will only work for reports with one attribute. To do this we’ll create a custom metric using the IFNULL function. For example, if we were reporting on # of Solved Tickets by Hour Ticket Solved, we would need to create a custom metric for the # of Tickets Solved Including 0.
To build the # of Solved Tickets metric:
Click Reporting in the sidebar, then click the Insights tab.
Click the GoodData link in the top right corner of the panel.
For reporting on the # of Solved Tickets, it’s easiest to duplicate the metric. In Insights click Manage > Metrics > # Solved Tickets > Duplicate.
Then we can work on building the new # of Solved Tickets Including 0 metric.
To build the # of Solved Tickets Including 0 metric:
Start by naming your new metric > Edit.
At the beginning of the metric type: SELECT IFNULL ((
At the end of the metric type: ), 0)*1
Click Save.
The last step is to create a report. There you have it – Your report will now maintain 0 values! Remember, the IFNULL function can be applied to any metric.
Head to the forums to see the step-by-step explanation of this tip of the week
Keep the knowledge flowing! For more tips like this, check out Zendesk’s Tip of the Week collection.
